
Content Moderation Survivor Bias
Content Moderation Survivor Bias
The pitfalls of analyzing emerging events on Twitter.

On November 24, 2022, a fatal residential apartment building fire broke out in Urumqi, China, killing several residents who had been locked into their apartments from outside as part of China’s zero-COVID effort. Protests against China's COVID-19 restrictions broke out in various cities in China, including Urumqi, Shanghai, Beijing, and Guangzhou. As is often the case, people turned to Twitter to find out more. However, when searching for the Chinese names of these cities, many people observed that news about the protests was difficult to find due to a deluge of spam and adult content using those city names as hashtags. Several analysts and news outlets suggested that this was a deliberate campaign — likely by the Chinese government — to drown out legitimate content with a flood of shady spam.
I argue that much of this "surge" in spam is illusory, due to both data bias and cognitive bias. I also argue that while the spam did drown out legitimate protest-related content, there is no evidence that it was designed to do so, nor that it was a deliberate effort by the Chinese government. To explain why, we must look at how historical social media data is biased.
Data Biases, Cognitive Biases
An underappreciated facet of social media analysis is that it is extremely dependent on when the data was gathered, because past data has often been removed or altered by users or the platform itself. When examining newly gathered data, spam and other platform policy-violating behavior will very often appear to have just recently increased, because content enforcement, particularly for low-risk content, is not immediate — it can take several days to detect, write enforcement rules or train models, and then remove content. Enforcement also does not occur linearly — content will be taken down in batches. Distortions can also occur due to the fact that gathering data via APIs can take multiple days — content may have changed or been removed by the time the data gathering mechanism even reaches it.
This same effect appears in various types of data (I discuss a similar effect with user creation dates here), and becomes more pronounced the more likely the data is to contain inauthentic behavior. In a sense, historical queries are prone to a form of survivorship bias: past data has potentially been moderated, while very recent data has not. Basing an analysis on the “surviving” content can distort what really happened.
This data bias is compounded by cognitive bias: the recency illusion, i.e. the perception that recently noticed things are more prevalent. For someone with no tendency to spend time searching hashtags of Chinese cities (or in Chinese-language Twitter in general), the volume of spam will seem sudden and anomalous, and quite possibly suspicious. And because gathering and analyzing data takes time, quickly drawn conclusions will often be based on small amounts of poor quality data.
As such, the only way to truly compare current with historical activity is to consume it over long timeframes in realtime before it has been acted upon, with the terms defined ahead of time — which was not the case in any of the analyses of Chinese spamming activity that we are aware of. In retrospective research, historical Twitter data generally becomes "cleaner" — some amount of spam and inauthentic behavior will have been removed — as you go further back, but this is necessarily a less accurate representation of what actually occurred on the platform. Put simply:
In a retrospective sample of moderated social media platform, ToS-violating or inauthentic content tends to appear most prevalent in the immediate past. We can call this Content Moderation Survivor Bias.
To illustrate this effect as best we can with data gathered after the fact, let's take a look at tweets containing the names of major Chinese cities.
Methods
Shortly after the deluge of spam was publicly noticed, we conducted a historical 1-week search for the following major Chinese cities in simplified Chinese. These 39 cities include the capital cities of all 31 provinces in China, Hong Kong, Macau, and 6 major prefectural-level cities across China such as Shenzhen and Qingdao.
"北京 OR 上海 OR 天津 OR 重庆 OR 哈尔滨 OR 长春 OR 沈阳 OR 呼和浩特 OR 石家庄 OR 乌鲁木齐 OR 兰州 OR 西宁 OR 西安 OR 银川 OR 郑州 OR 济南 OR 太原 OR 合肥 OR 长沙 OR 武汉 OR 南京 OR 成都 OR 贵阳 OR 昆明 OR 南宁 OR 拉萨 OR 杭州 OR 南昌 OR 广州 OR 福州 OR 海口 OR 香港 OR 澳门 OR 大连 OR 青岛 OR 苏州 OR 无锡 OR 厦门 OR 深圳"
Romanized translation:
“Beijing OR Shanghai OR Tianjin OR Chongqing OR Harbin OR Changchun OR Shenyang OR Hohhot OR Shijiazhuang OR Urumqi OR Lanzhou OR Xining OR Xi’an OR Yinchuan OR Zhengzhou OR Jinan OR Taiyuan OR Hefei OR Changsha OR Wuhan OR Nanjing OR Chengdu OR Guiyang OR Kunming OR Nanning OR Lhasa OR Hangzhou OR Nanchang OR Guangzhou OR Fuzhou OR Haikou OR Hong Kong OR Macau OR Dalian OR Qingdao OR Suzhou OR Wuxi OR Xiamen OR Shenzhen”
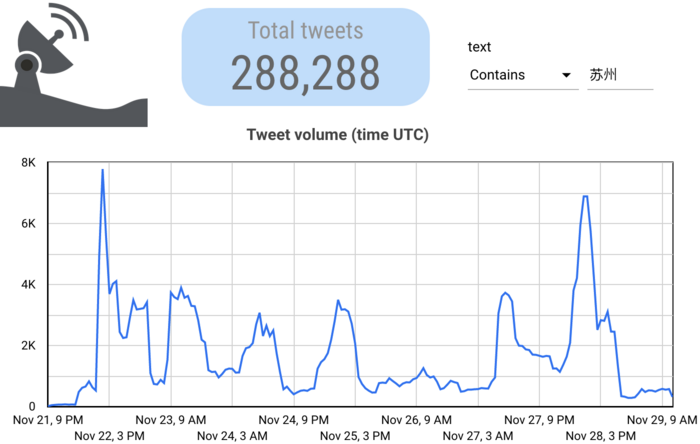
Our search, started on November 29th, extracted tweets that contain these cities’ Chinese names between 9pm on November 21st and 5am on November 29th.

This showed a marked overall increase in use of the city names (usually as hashtags) on the 27th and 28th, the vast majority of which was spam. However, it also shows that this type of content was still somewhat prevalent before the fire in Urumqi (at around 12:00pm UTC on November 24th) and the subsequent protests. We also observed that the frequency curves varied significantly depending on city; for example, spam citing Suzhou appearing markedly different from Lanzhou:

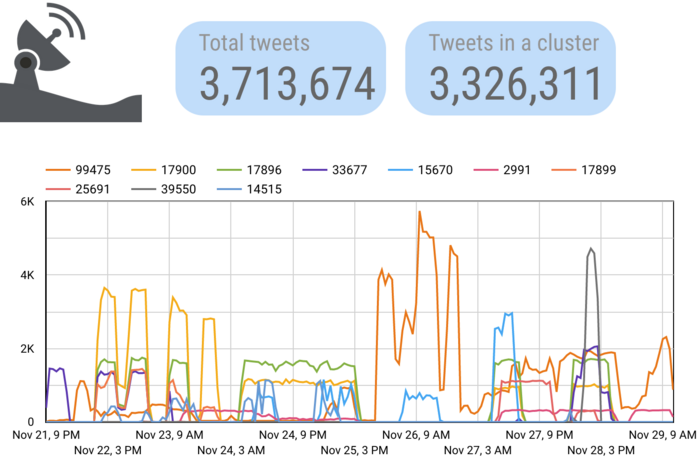
We also identified many distinct spam campaigns and strategies using fuzzy clustering of tweet text. Tweets like those below that used a particular phrase but with slightly different hashtags or URLs would tend to cluster together, allowing us to see their use over time.
| Image

| Image

|
Some of these campaigns appeared to have originated recently, while some appeared to be long-standing. The ten most active clusters are shown below — the labels are the numeric ID of the cluster. Note that we cannot share tweet text extracted from the API due to Twitter’s API access terms.
User creation dates showed what we would expect for a dataset containing a significant level of inauthentic behavior: a strong bias toward the past month or so, as new accounts are created to replace those that get suspended.
| Image

|
We hypothesized that this spam was commercial in nature and unrelated to the fire and protests — in part based on the content itself, the links to apparently real commercial ventures, and those ventures’ presence on other platforms. We further hypothesized that the apparent recent surge was due to a combination of:
- Content enforcement lag
- An organic increase in non-spam mentions
- Hashtag bandwagoning
To test this, we performed 3 additional searches:
- A 2-week search to compare prior activity (started Nov 30th)
- A 1-week search into the past (started Dec 4), to see if the “surge” in the immediately preceding days appeared when looking at a more recent period
- A search for the original 1-week timeframe conducted at a later date, to see if the “surge” had flattened (conducted Dec 8).
Historical Trends
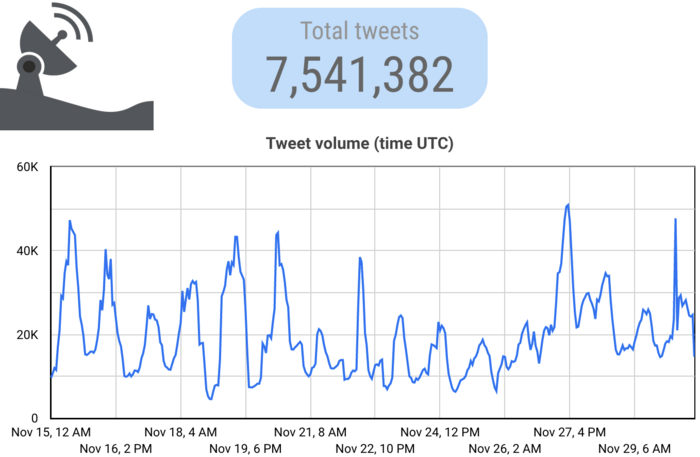
Our two-week full archive search from the 15th to the 30th showed that spam of this type (henceforth referred to as “city spam”) had actually been prevalent for quite a while before the fire in Urumqi and subsequent protests — if anything, it experienced a bit of a lull from the 21st to 26th. Also of note is that the previous peak on the 28th had been sharply attenuated since our original search.
Activity Post-Protest
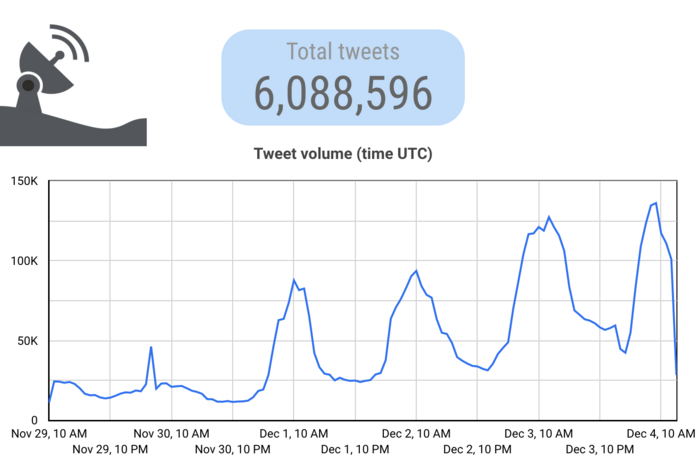
To see if we could replicate the recency bias with the same query over a different, more recent time period, we conducted a one-week search on December 4 which scraped tweets posted between November 29 and December 4. This query shows the same bias in frequency for the prior two days — actually showing the volume far exceeding the peaks in November, well after the protests had largely dissipated. This could be due to a significant increase in activity, a failure of Twitter’s anti-spam systems, or very likely a combination. This runs counter to what we would expect to see if the Chinese government were sponsoring the spam.
Re-query of original week
To see how the curve changed once we had more temporal distance from the events we were examining, we performed another search for the original timeframe (between November 23 and November 28), with the original terms, but conducted on December 8th.
This shows the 70k peak formerly present on the 28th to be cut almost in half, with the peak on the 27th reduced modestly. This updated curve follows the curve of retweeted content (which we found to be mostly legitimate — city spam campaigns mentioned other accounts but did not retweet), indicating that there was a spike of legitimate content on the 27th (i.e. at the peak of mass protests across cities in China).
Protest-specific Hashtags
Finally, on December 16, we performed a search for commonly seen protest-related hashtags and slogans between November 22nd and December 1st:
"白纸革命 OR 白纸行动 OR 白纸抗议 OR A4纸革命 OR OR #A4Revolution OR #WhitePaperRevolution OR #ChinaProtest2022 #ChinaUprising"
The prevalence of content using these hashtags was modest, with 48,603 tweets, peaking November 29th. We posit that if the Chinese government were to attempt to drown out dissent with spam, it would target protest-related hashtags rather than those representing entire cities.
Findings
- Contrary to several reports, city spam was prevalent on the platform prior to the protests, and had peaked and waned before.
- Our two separate 1-week queries showed a “surge” in the days immediately prior to the execution of the search query, illustrating the unmoderated content bias.
- Subsequent queries of the original week preceding and following the protests showed a disappearance of the most recent spike, with a largely organic increase on the 27th remaining. This flattening of the “surge” is consistent with content moderation lag.
- While such spam did drown out legitimate protest-related content, and curiously showed up on the Top tab as well as Latest, it is unlikely that this was an intended effect.
- Twitter continues to have significant problems proactively suppressing this spamming activity, likely a result of staffing shortages in both moderation and automated systems training.
- We did not see strong evidence of active hashtag bandwagoning, i.e. spam networks adopting the use of the most popular hashtags at the time.
Red herrings
- “Many accounts were just recently created” and “many accounts had long been dormant before tweeting” are both very common characteristics of spam and other forms of CIB, and do not indicate anything beyond that — certainly they are no smoking gun toward state involvement, because commercial spammers will continually create and use new accounts to replace accounts that are removed by the platform.
Conclusion
Social media data is complex and often weird; looking at it closely, we often find patterns that seem to require deeper explanation. However, the field of social media analysis has focused so much on detecting potential coordinated, state-backed activity that it often jumps to this conclusion, particularly in media coverage, at the expense of rejecting more subtle (and boring) explanations. This is likely exaggerated by publication bias, as "this is pretty normal, actually" is not generally a compelling research finding or news article. Researchers and reporters need to be wary of making judgements of attribution and intent without having obtained the data necessary to do so, and should take bias into account when analyzing recent events.
That said — despite no indications of state backing, Twitter does appear to be doing quite poorly at controlling Chinese-language spam, which does make information on protests hard to find. The situation is likely compounded by the recent gutting of Twitter’s Trust & Safety, Research, and Communications teams, leaving them with reduced capacity to perform internal research on inauthentic behavior and limiting the possibility of collaboration with researchers and journalists to improve curbs on violating content. As of this writing, the flood of Chinese city spam continues unabated.
Thank you to Tongtong Zhang for investigation and translation support.
